The Comparison report is only available for System Administrators and Global Users. This report gives you a holistic view of the District’s state so you can visually see the progress of users, topics, and categories and quickly identify areas where your team excels or is struggling to provide actionable next steps.
Accessing the Comparison Report
- Click the Dashboard (bar graph) icon in the top left-hand corner of your account.
- On the left-hand side of the screen, under Comparison, click on Users, Categories, or Topics.
Reading the report
The Comparison Grid:
The X-Axis of the grid represents the Average Dialogue Age while the Y-Axis of the grid represents the Average CX Score. Depending on the report selected, the dots represent Users, Topics or Categories. The graph charts 4 quadrants:
- Top-right: Stellar Service. Dots under this quadrant display areas, users and categories that are doing well in delivering exceptional customer experience.
- Top-left: Improve Response Time. These dots are receiving high scores when it comes to feedback, but compared to the rest of the district, they might be slow to resolve dialogues.
- Bottom-right: Improve Service Quality. Areas, users, and categories under this quadrant are quick to resolve dialogues but aren’t hitting high marks when it comes to receiving feedback.
- Bottom-left: Risk Areas. These dots require the most focus as they are both slower in responding as well as receiving low scores from customers.
- Pro tip: Use the map located on the top right corner to focus in on any quadrant.
The Comparison Bars:
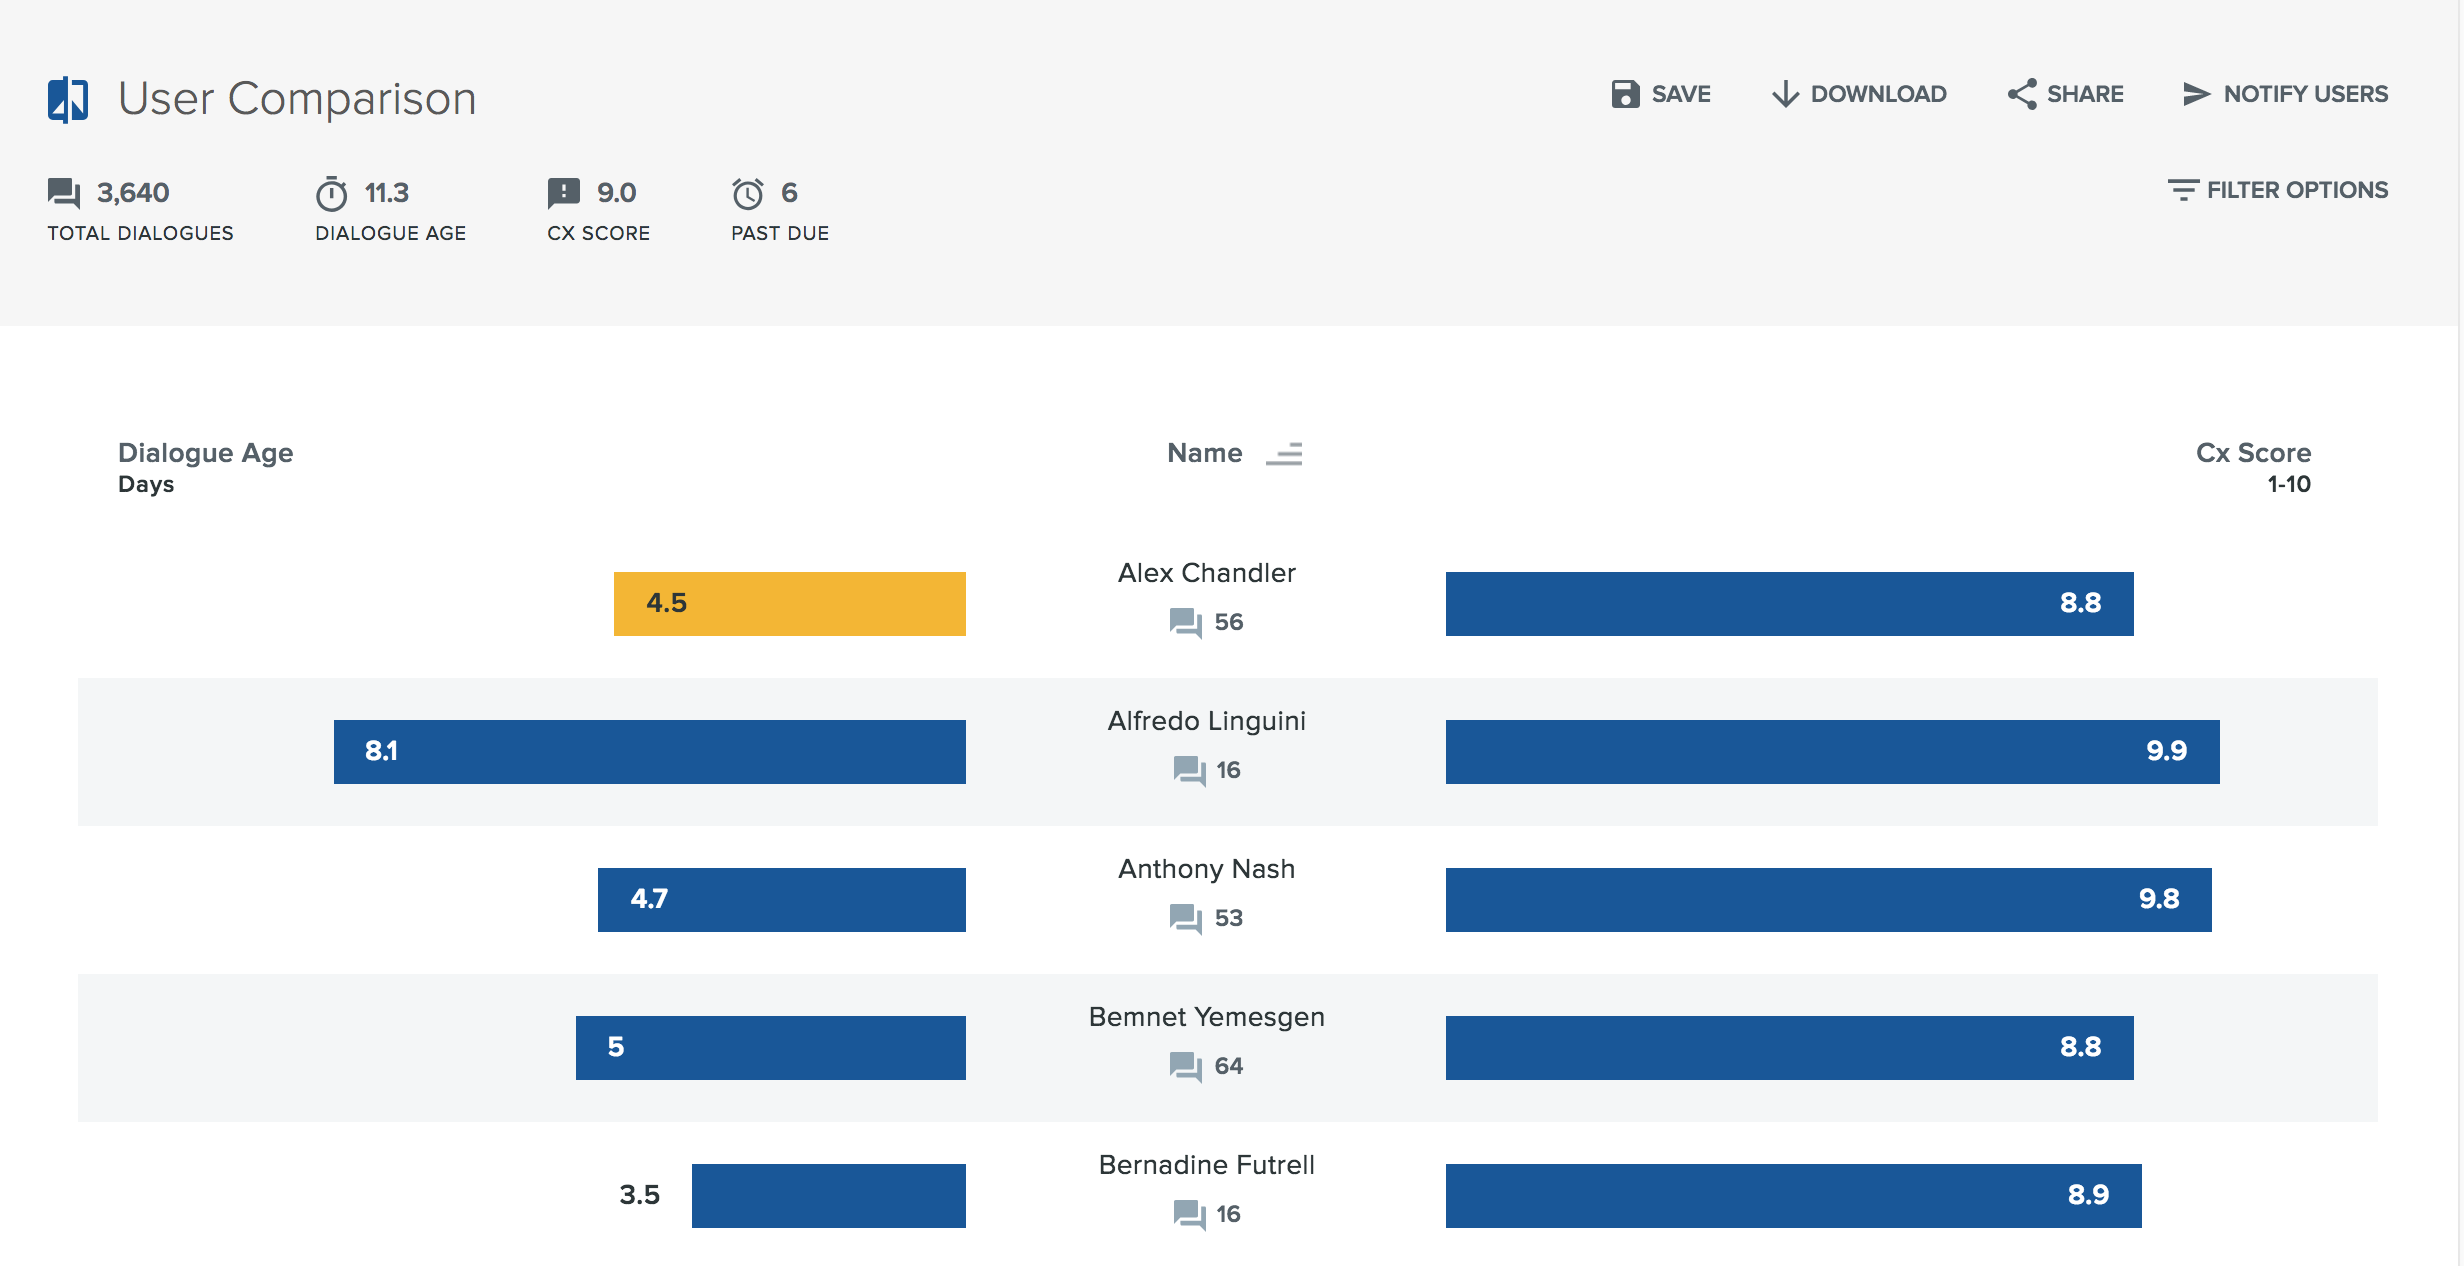
- Each comparison report graphically displays the average Dialogue age on the left and average Cx Score on the right for each of the listed items.
- The center column will display the User’s name, Topic, or Category respectively based on the selected report as well as the total number of dialogue and any unresolved critical dialogues belonging to that entity.
- By default, items will be listed in alphabetical order. The district average will be shown at the bottom of the list.
Dialogue Age
- The Dialogue Age bar on the left side will display the average time it takes to close out dialogues.
- A yellow dialogue age bar indicates that there are past due dialogues if any.
- Hover over the bar to see the number of past-due dialogues.
Cx Score
- The Cx (Customer Experience) Score bar on the right side will display the average score received from customers
- A yellow Cx score bar indicates that the average score is categorized as negative which is a score of 5 or below. (This only applies if the Topic has 5 or more dialogues total)
- Hover over the bar to see the number of dialogues that received a Cx Score
Drilling down
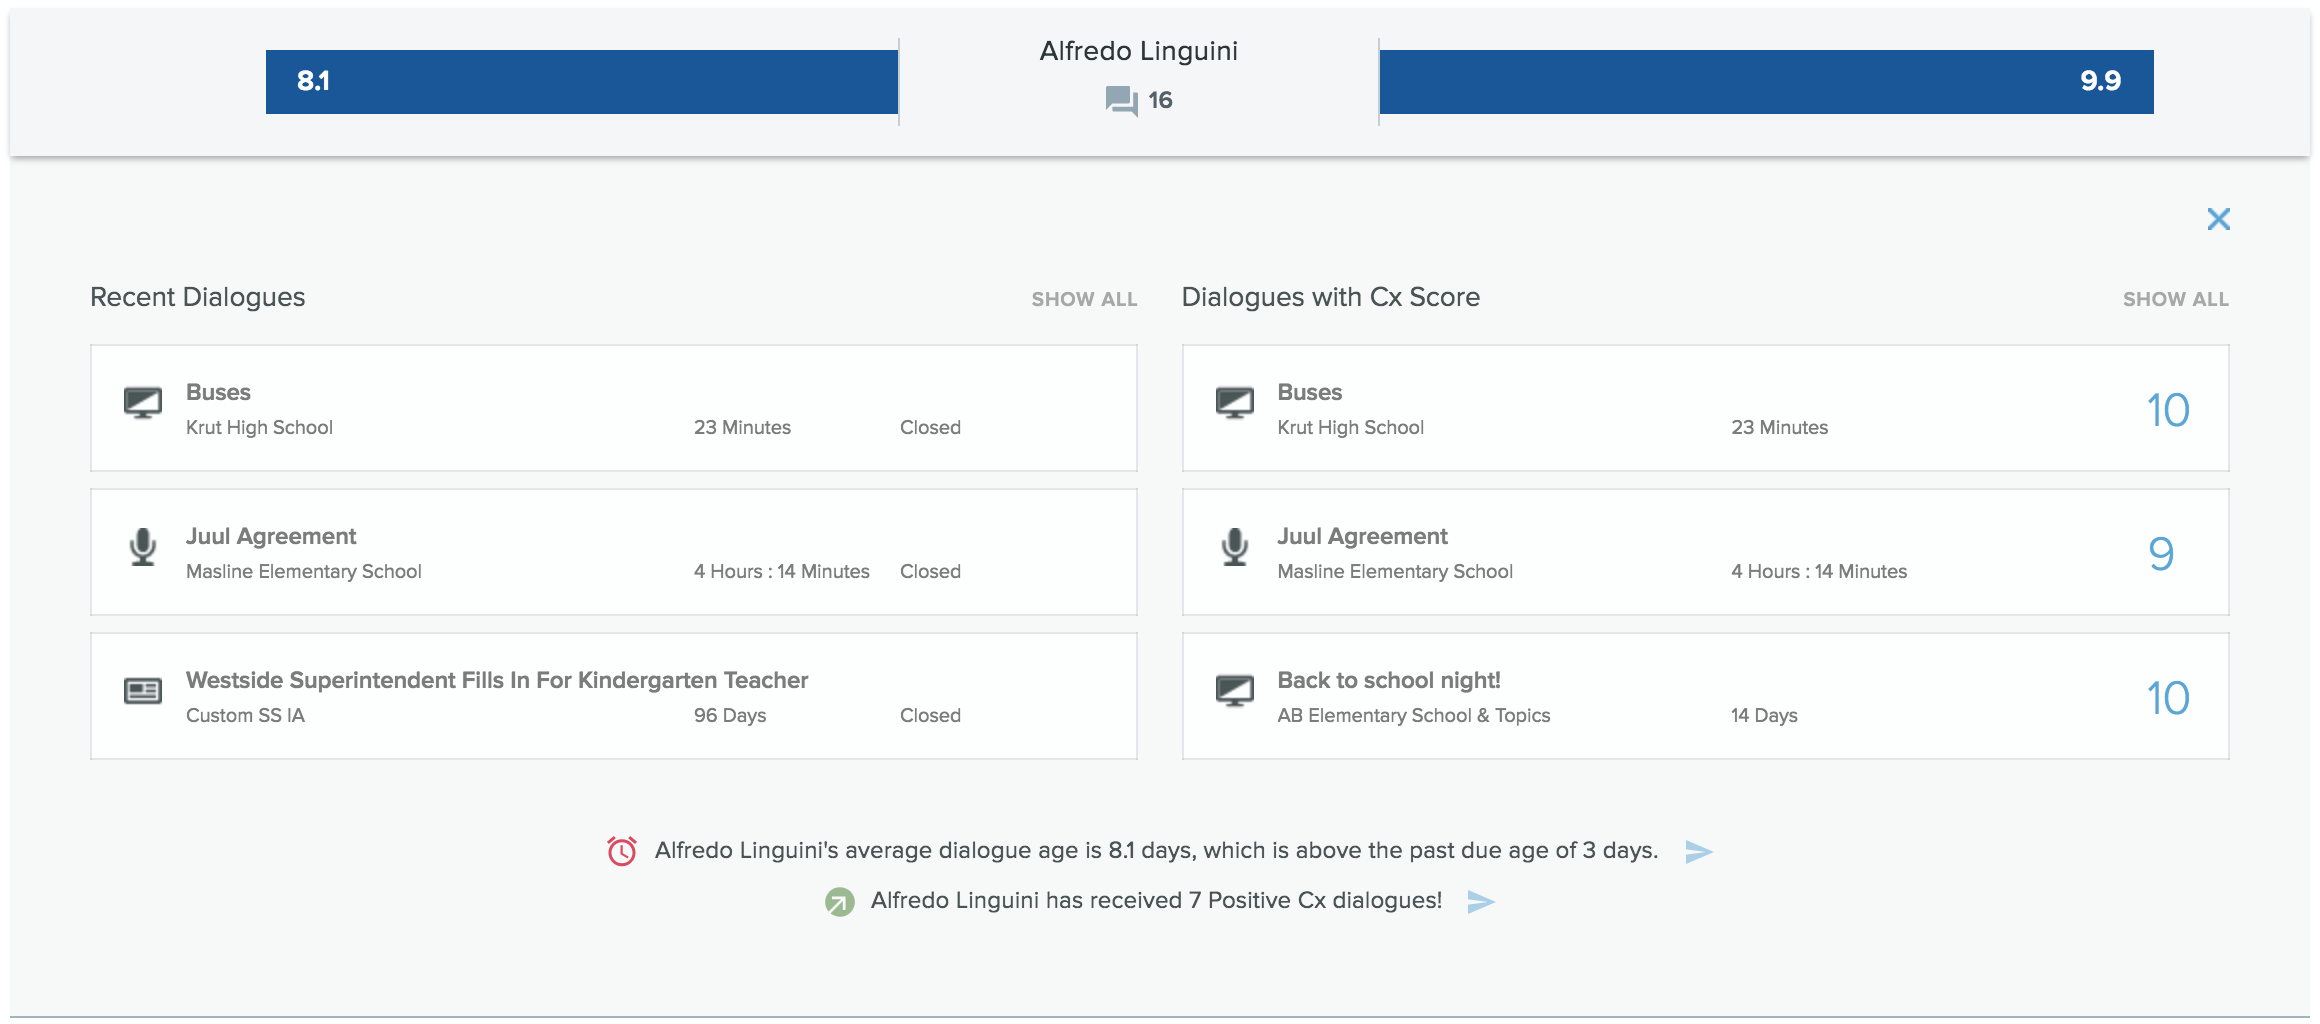
- To drill down on the comparison report, simply click on the column or bars to see an expanded view.
- On the right side, you will see the top 3 recent dialogues, which appear in the recency of the received date.
- On the left side, you will see the top 3 recent dialogues that received Cx Scores which appear in the recency of the dialogue received to date.
- Each dialogue card displays the Subject Line, Topic, Dialogue Age, and Status. The entry point of the dialogue is denoted by the icon on the far left-hand side.
- Clicking on an individual dialogue card will open up the dialogue in another tab.
Notify Users
- The comparison report allows you to send notifications to your users for a number of reasons – such as reminding them about past due dialogues or cheering them on for receiving positive Cx scores.
- For User Comparison – the notifications go to the User
- For Topic and Category comparisons, notifications go to the owner of the Topic
- For Topic Category comparisons, notifications go to the owners of the all the Topics within the category
There are two ways to notify your users:
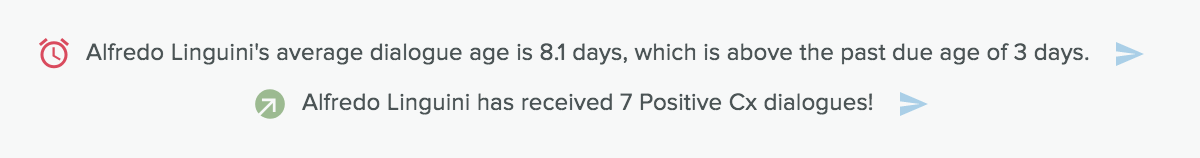
- Specific Users/Topics: When you drill down, you will find statement sentences at the bottom of the expanded view. These statements will tell you recent summaries of the users or topics. Click on the paper plane icon to notify the user based on that statement.
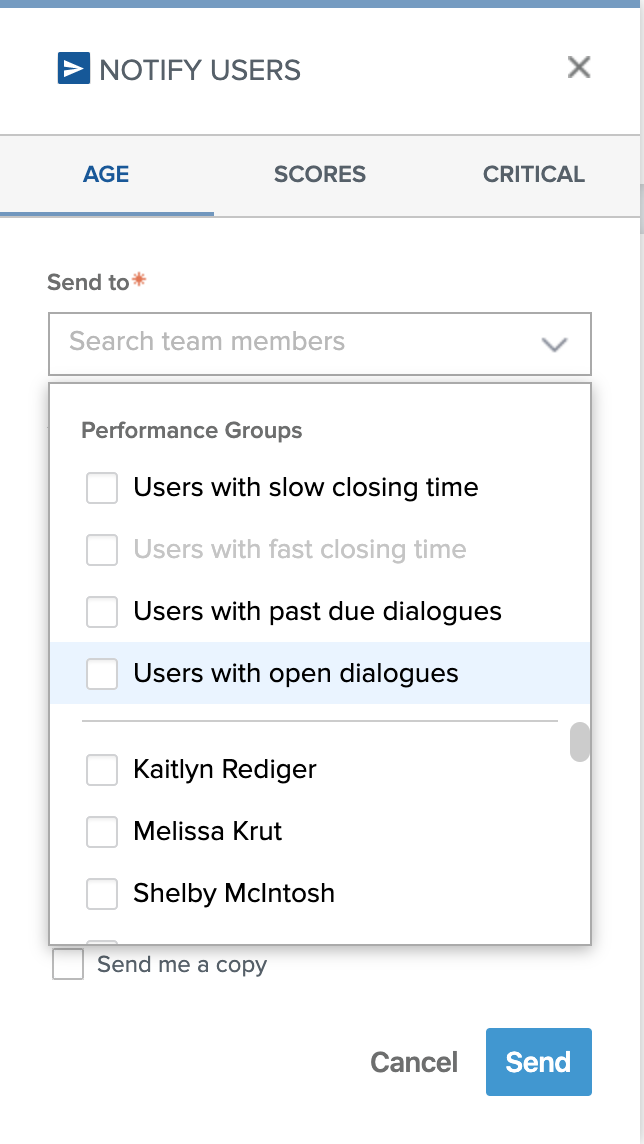
- Notify Users based on performance groups: Click on Notify Users at the top right-hand corner of the report, you can notify users in bulk based on performance groups. Choose from:
- Age
- Users with fast closing time (average dialogue age is less than the district past due definition)
- Users with slow closing time (average dialogue age is more than the district past due definition)
- Users with any past due dialogues
- Users with any open dialogues
- Scores
- Users with positive experiences (Cx scores of 8 or above)
- Users with negative experiences (Cx scores of 5 or below)
- Critical
- Users who have unresolved critical dialogues
- Age
Save, Download, Share and Filter!

- Save comparison reports by clicking the Save button at the top right-hand corner. Give the report a title, and all saved reports will appear on the left-hand navigation menu.
- Download comparison reports in two different formats: PDF or Excel
- Share comparison reports via email which will provide your recipients with a live and interactive link of the report
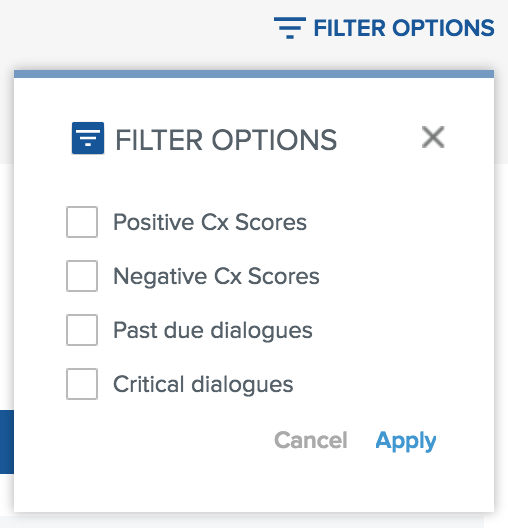
Use the Filter Options to filter your comparison report for the following performance groups
- Users who have an average positive Cx Score
- Users who have an average negative Cx Score
- Users who have unresolved critical dialogues
- Users who have past due dialogues