To help you understand the impact of your Let’s Talk Assistant – and to see trends that can help you improve your knowledge base – we have designed the Let’s Talk Assistant Report. (Access available for System Admins)
Access
To help you understand the impact of your Let’s Talk Assistant – and to see trends that can help you improve your knowledge base – we have designed the Let’s Talk Assistant Report.
Overview
The first section of the report features the Overview section that contains metrics relevant to the chatbot interactions. The metrics below measure the following:
- Total Questions Asked: Total number of questions asked to the chatbot. This number measures each time the chatbot is engaged for the first time, as well as anytime a customer selects that they have another question they like to ask.
- Helpful: The number of times a customer selects that the answer provided by the chatbot is Helpful. This question comes after the chatbot sends over a response from the knowledge base.
- Unhelpful: The number of times a customer selects that the answer provided by the chatbot is Unhelpful. This question comes after the chatbot sends over a response from the knowledge base.
- Not Rated: The number of times a customer did not rate whether a response was helpful or not when prompted by the chatbot.
- No Answer: The number of questions the chatbot was exposed to that it was not able to provide a response for.
- Sessions Started: The number of times the chatbot has been engaged by a customer. This only measures the interaction, rather than the number of questions asked by a customer.
- Average Cx Score: The average Cx score recorded for chatbot interactions, only
- Note: customers are asked to rate their experience with the LT! Assistant on a five-star scale that is converted to a 10-point scale to align with other Let’s Talk Cx metrics.
Dialogues Submitted: The number of chatbot interactions that have resulted in a dialogue submission in Let’s Talk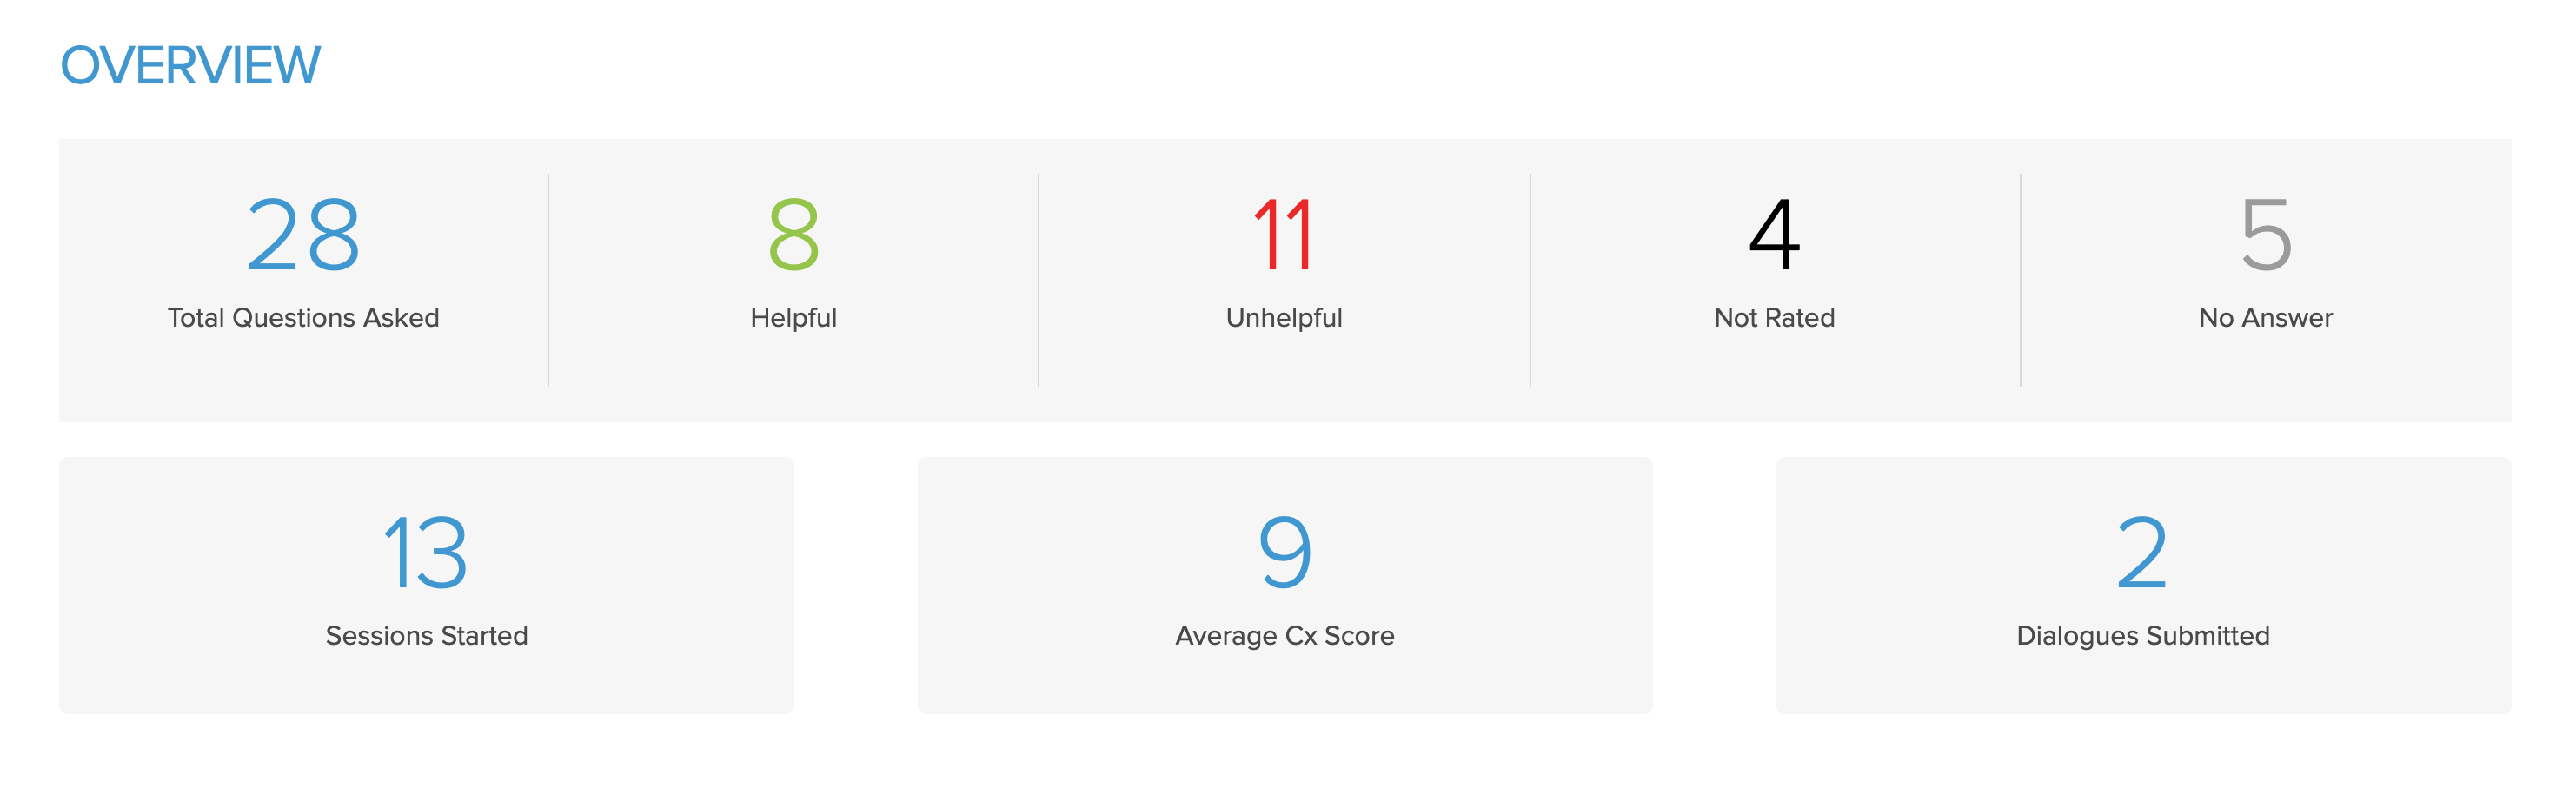
Engagement
The Engagement section of the report is a graph that showcases the usage of the chatbot across time. The legend at the top right shows you the breakdown of the questions coming into chatbot for that period of time on the graph.
- Green indicates Helpful
- Red indicates Unhelpful
- Dark grey indicates Not Rated
- Light grey indicates No Answer
Interactive items:
- Hover over the bars to get a breakdown of how many questions asked fall into each category.
- Check or uncheck the Number of sessions started and Number of questions asked boxes in the legend to remove or enable it on the graph.
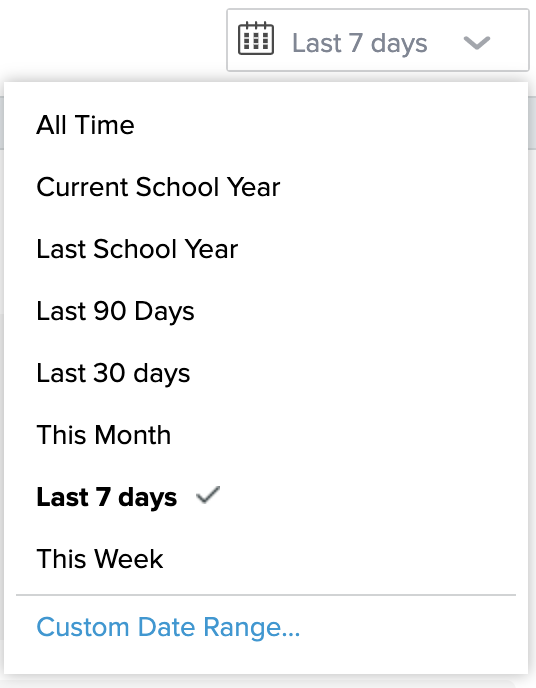
Filter
Like all other dashboards in Let’s Talk, at the top right-hand corner of the report, you can find the date filter. This filter will change your data to only reflect the time period you select. Choose from any of the preset date ranges or click on Custom Date Range to create your own.
It’s easier than ever to deliver instant and accurate answers with generative AI-powered Let’s Talk Assistant. If you don’t have Let’s Talk Assistant live on your website and want to begin saving time for your team by offering AI-powered customer service, reach out to your Client Success Manager to activate the chatbot for your account.