This article is designed for Onflo (formerly Let's Talk!) System Administrators and Call Center Managers to demonstrate the features of Onflo Call Center Dashboard to assist you in tracking performance, identify trends, and make data-driven decisions that enhance service quality, optimize workflows, and improve overall call center operations.
Call Center Dashboard Features
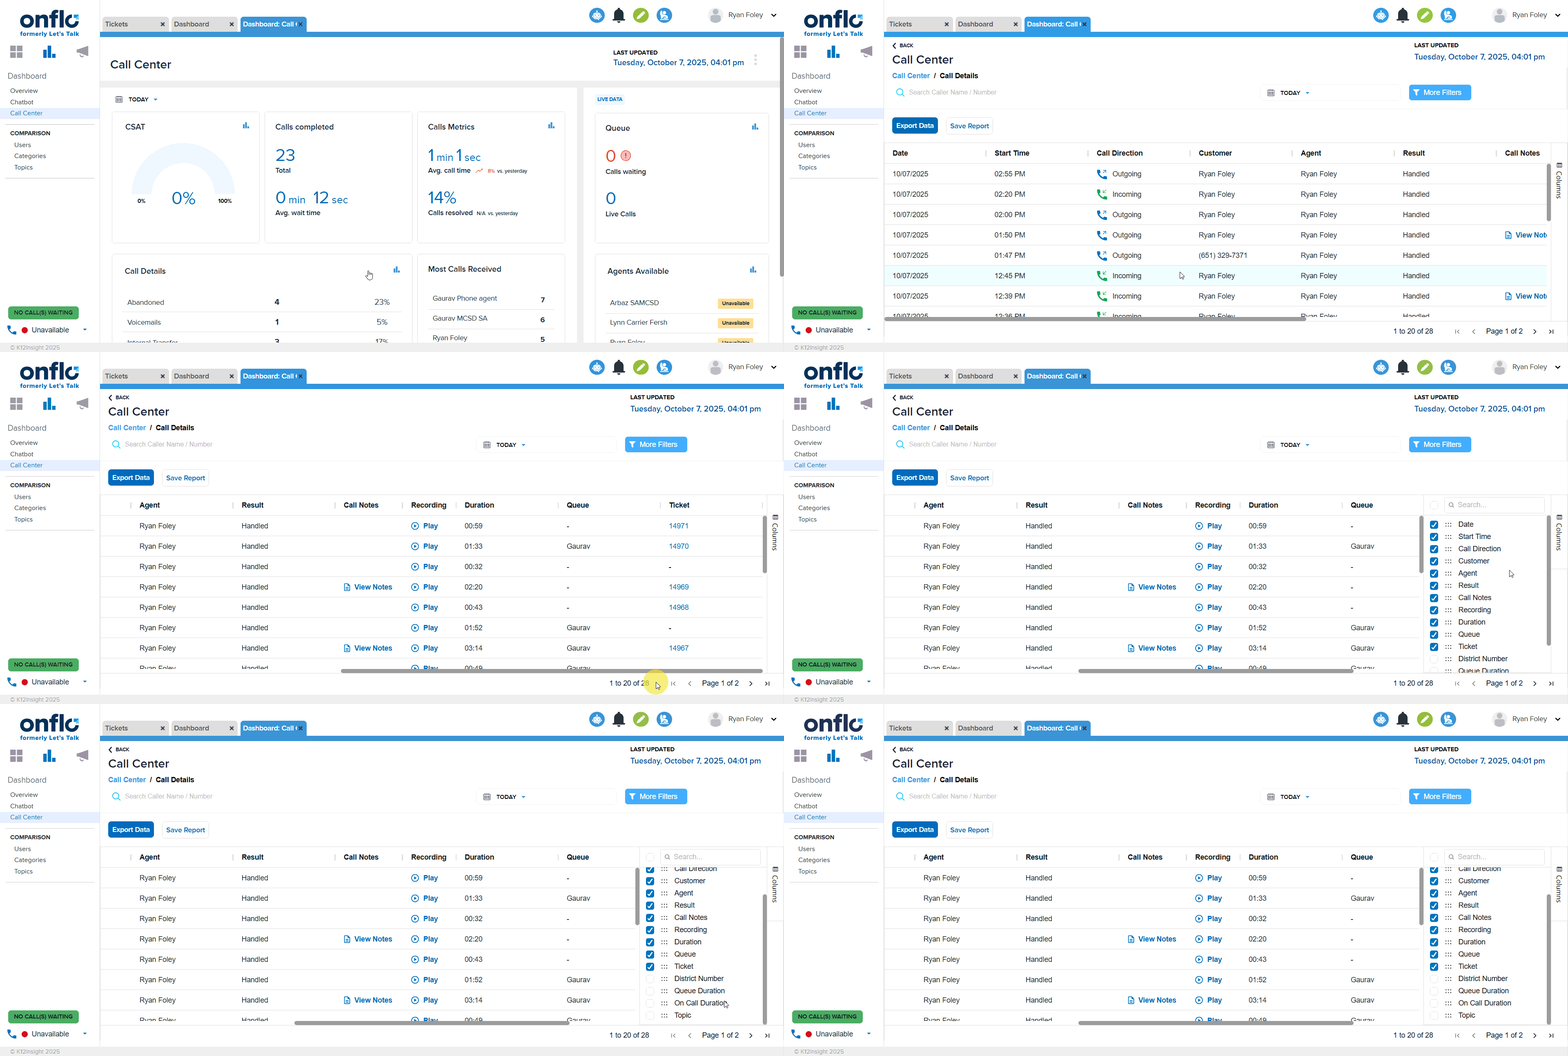
This dashboard gives a high level overview of activity within your Onflo Call Center so you can view key performance indicators of your support agents and Live Data..The indicators include the following:
- Customer Satisfaction
- Calls Completed
- Calls Metrics
- Calls Details
- Most Calls Received
- Live Data
- Agents Available
Getting Started: Accessing the Dashboard
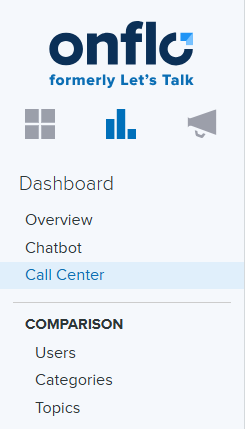
To access this dashboard you will need to click on the Dashboard icon then click on Call Center in your Onflo panel
Data Timeframe
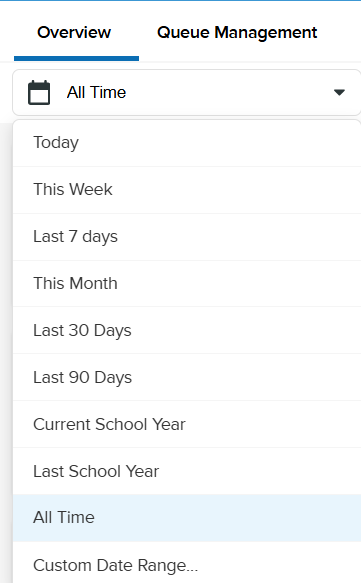
Now that you have accessed the dashboard you will want to determine what timeframe you want to use for all metrics displayed in the tiles of this dashboard. Data within this dashboard (excluding Live data) is based on the time frame that is selected by the user. The dashboard will default to Today when it is initially launched, but this can be adjusted to your needs by clicking on the drop down menu in the top-left corner of the dashboard report
Save/Export/Share Report
When working within the Dashboard the option to Save, Download, or Share this information is available by clicking on the 3 vertical dots in the upper right corner of the Call Center dashboard
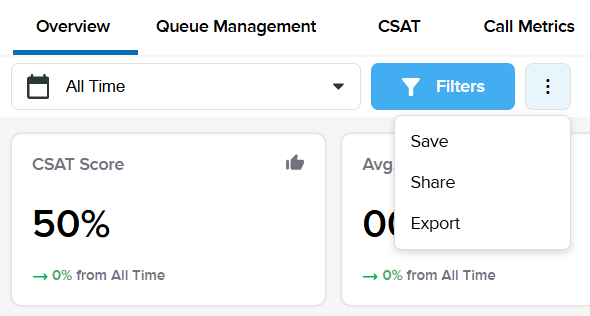
Save Report
- Click the 3 vertical dots
- Click Save
- Type in a name of the Report
- Click Save
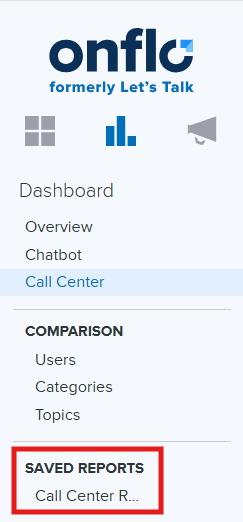
The Report will appear under the Saved Reports section of the Onflo panel in your account
Download Report
- Click the 3 vertical dots
- Select the report format you wish to download the report in (PDF, Power Point)
- Click Download
The Report will be downloaded to your device for access.
Share the Report
- Click the 3 vertical dots
- Select Share
- Fill out the Form
- Send To (Email address)
- Subject
- Message
- Check box for Send me a Copy (optional)
- Click Send
The Report will be sent to the person you indicated in the form.
Note: The Call Details Report can only be Saved or Exported.
Overview of Call Center Features
Now that you have determined the dashboard timeframe you can begin to utilize the features within the dashboard. The Call Center dashboard offers a comprehensive overview of key performance indicators to help optimize operations including the following:
- Dashboard Overview
- Queue Management
- CSAT (Customer Satisfaction) scores
- Call Metrics
- Call Details
- Agent Status
These features empower managers to make data-driven decisions and enhance overall customer experience.Before we review the key areas of the dashboard we will outline how to Save, Export, and Share the dashboard data.
Dashboard Overview
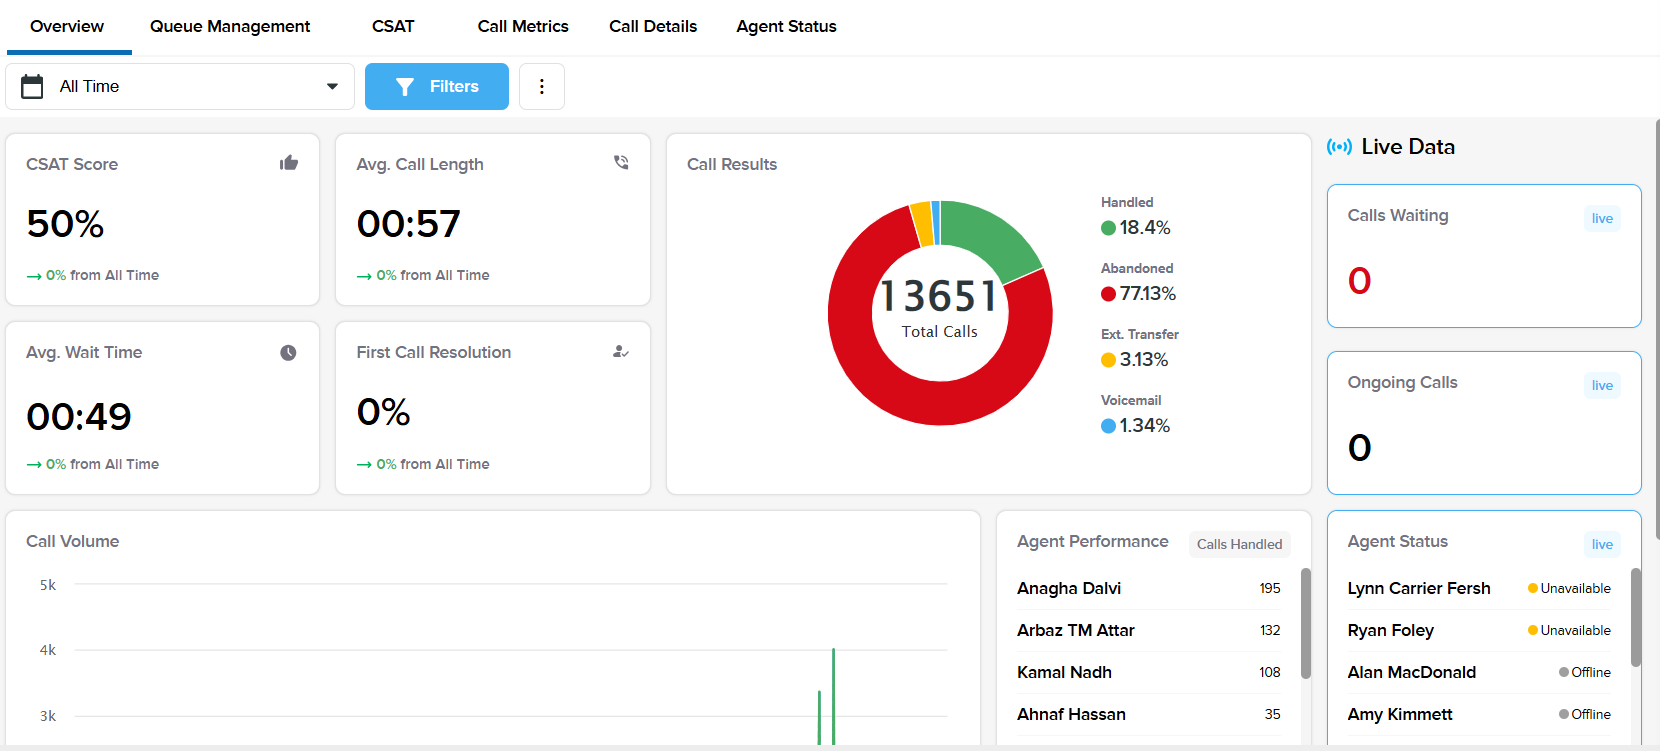
The Dashboard overview offers an extensive and in-depth view of crucial call center metrics and real-time operational data. This tool is designed to empower you with the insights needed to significantly enhance agent efficiency, streamline call center operations, and ultimately foster a more productive and responsive customer service environment. The Dashboard provides a snapshot of the following areas:
Metrics
- CSAT
- Average Wait Time
- Average Call Length
- First Call Resolution
- Call Results
- Call Volume
- Agent Performance (Calls Handled)
Live Data
- Calls Waiting
- Ongoing Calls
- Agent Status
Customer Satisfaction (CSAT)
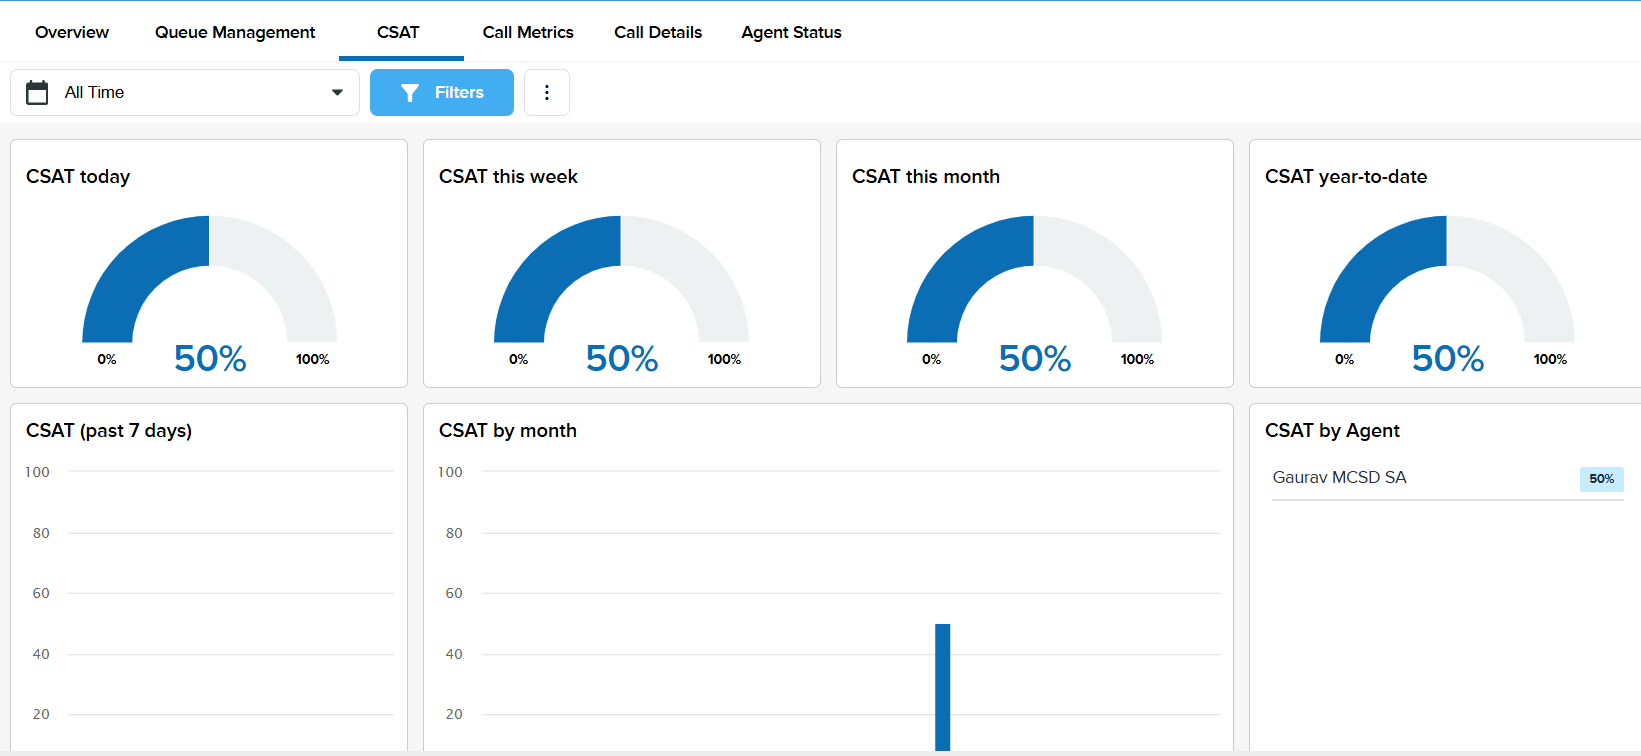
The Customer Satisfaction (CSAT) tab in the dashboard reflects the quality of service provided by a call center. It measures how well customer expectations are met, helping identify areas for improvement and ensuring a positive customer experience.
CSAT scores can be viewed based on the following time frames: Current day, Week, Month, or Year. Additionally, Individual agents are also assigned CSAT ratings which can be viewed in the CSAT by Agent menu
Call Metrics
The Call Metrics tab in the dashboard provides key insights into call center performance.
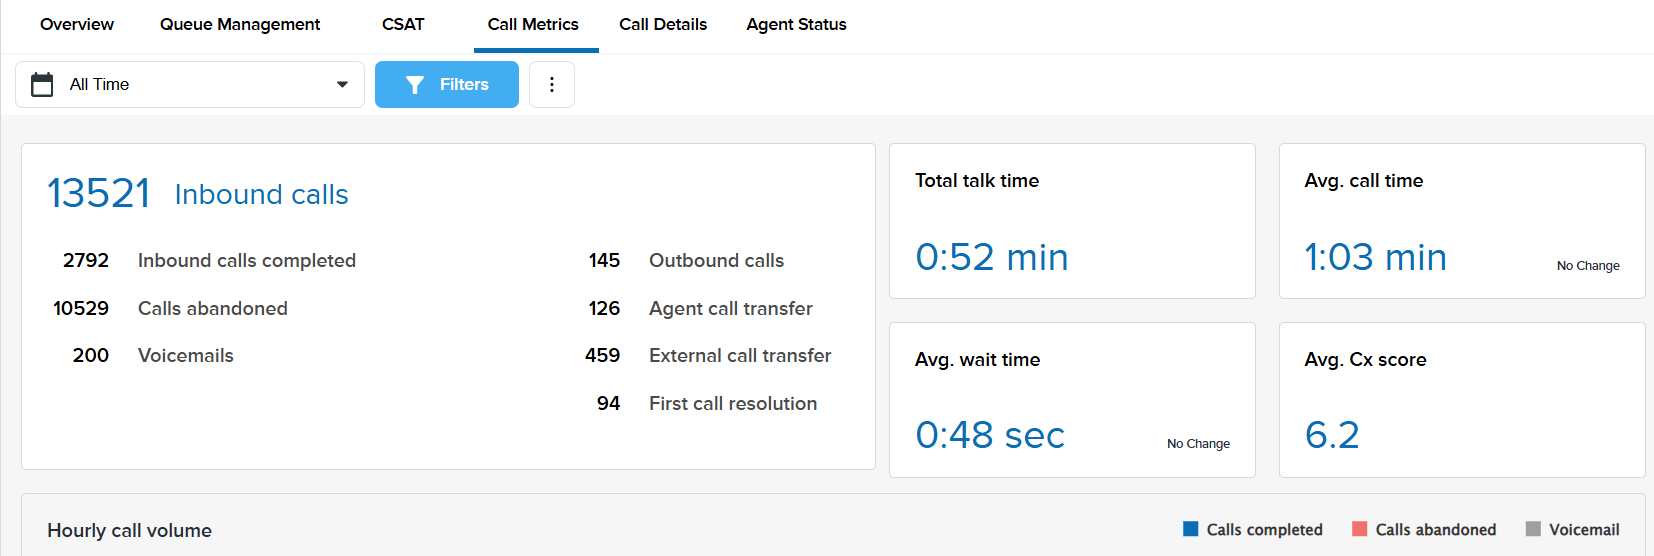
This tile includes the following metrics:
- Inbound and Outbound Calls
- Abandoned Calls
- Agent and External Call Transfers
- Voicemails
- Total Talk Time
- First Call Resolution
- Average Call Time
- Average Wait Time
- Average Customer Experience Score
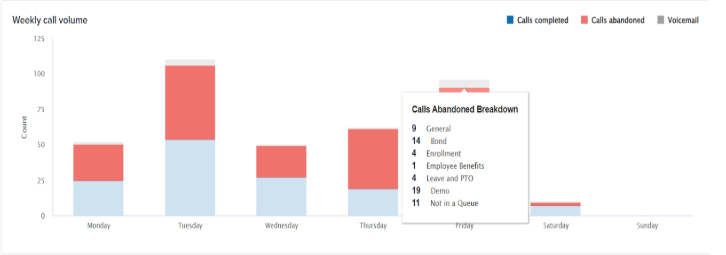
Additionally this report contains a graphical representation of call volume based on Hourly or Weekly Call Volume and time of day (hourly) or day of the week (weekly). Hovering over the graph will provide a breakdown of each call type by Topic in your district’s Onflo account.
Call Details
Now that we reviewed all metrics offered in the dashboard this next section will outline the details of individual phone calls. To access this data please click on the icon in the Call Details tab.
 Details Available
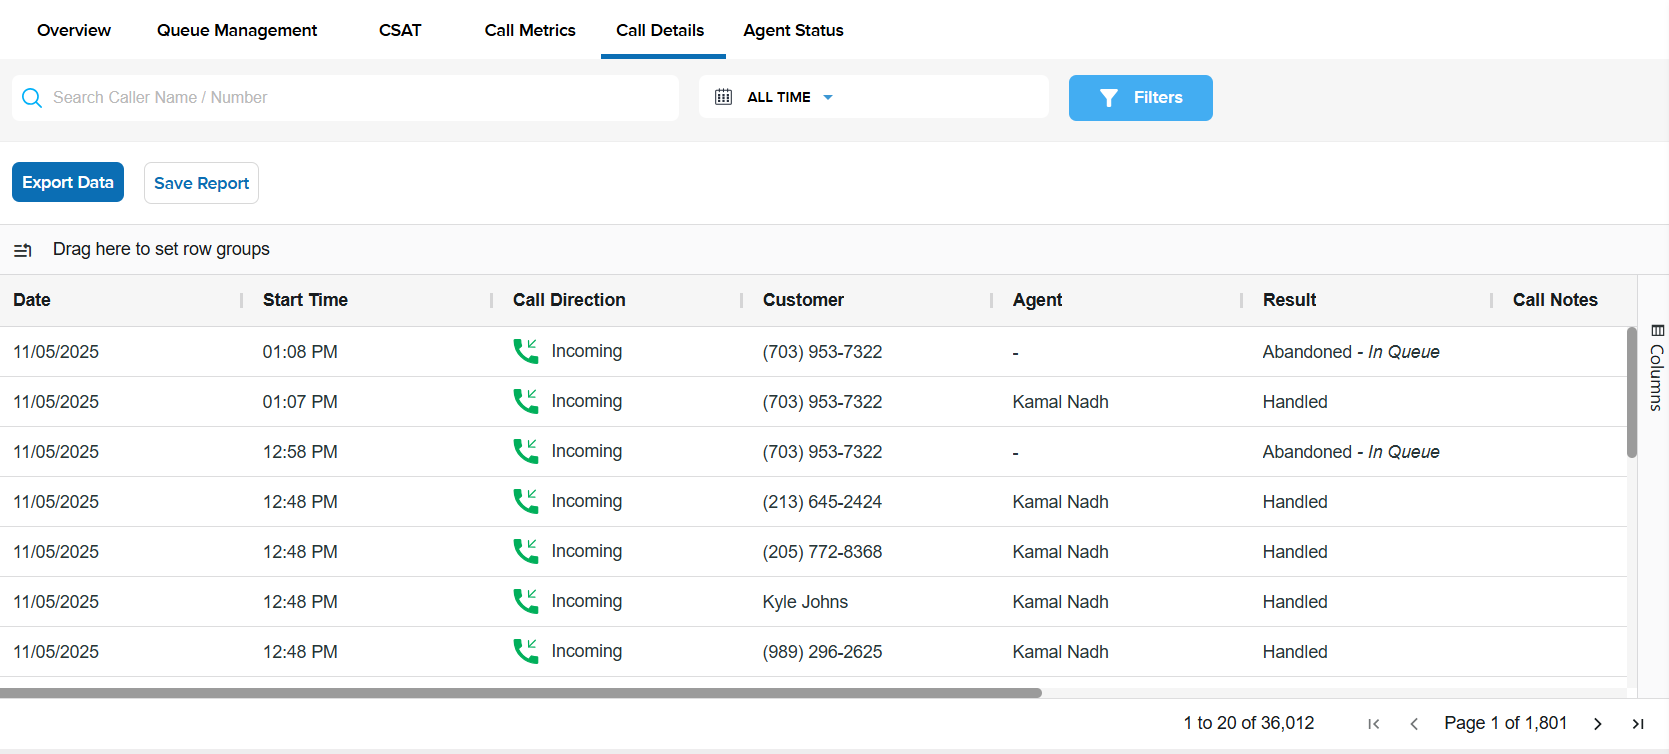
There are several components included in the Call Details section:
- Date of Call
- Start Time of Call
- Call Direction
- Incoming
- Outbound
- Customer Name
- Agent Who Took Call
- Result of Call
- Call Notes
- Recording of Call
- Call Duration
- Queue
- Ticket Number
Additionally, we offer metrics to show how calls are handled and routed including the following:
- District Number
- Queue Duration
- On Call Duration
- Topic
Customize Table
You can customize your table view by clicking Drag here to set row groups. This will allow you to arrange the columns to your desired specifications. Additionally, clicking on Columns will allow you to select what data you wish to view in the table. In addition we provide Pivot Mode for the table as well.
Results of Call
- Handled
- Abandoned
- Abandoned - Agents Unavailable
- Abandoned - In Queue
Calls sent to voicemail from a queue will be marked as "Abandoned - In Queue". Calls that result from no agents being available to accept the call will be marked as "Abandoned - Agents Unavailable". This field helps to provide clear reporting and identify trends for making necessary enhancements to your call center.
Search, Save, and Export Call Details
To find specific call information you can also search for an individual call in this log or filter the call by using the Search Bar or Filter By button.
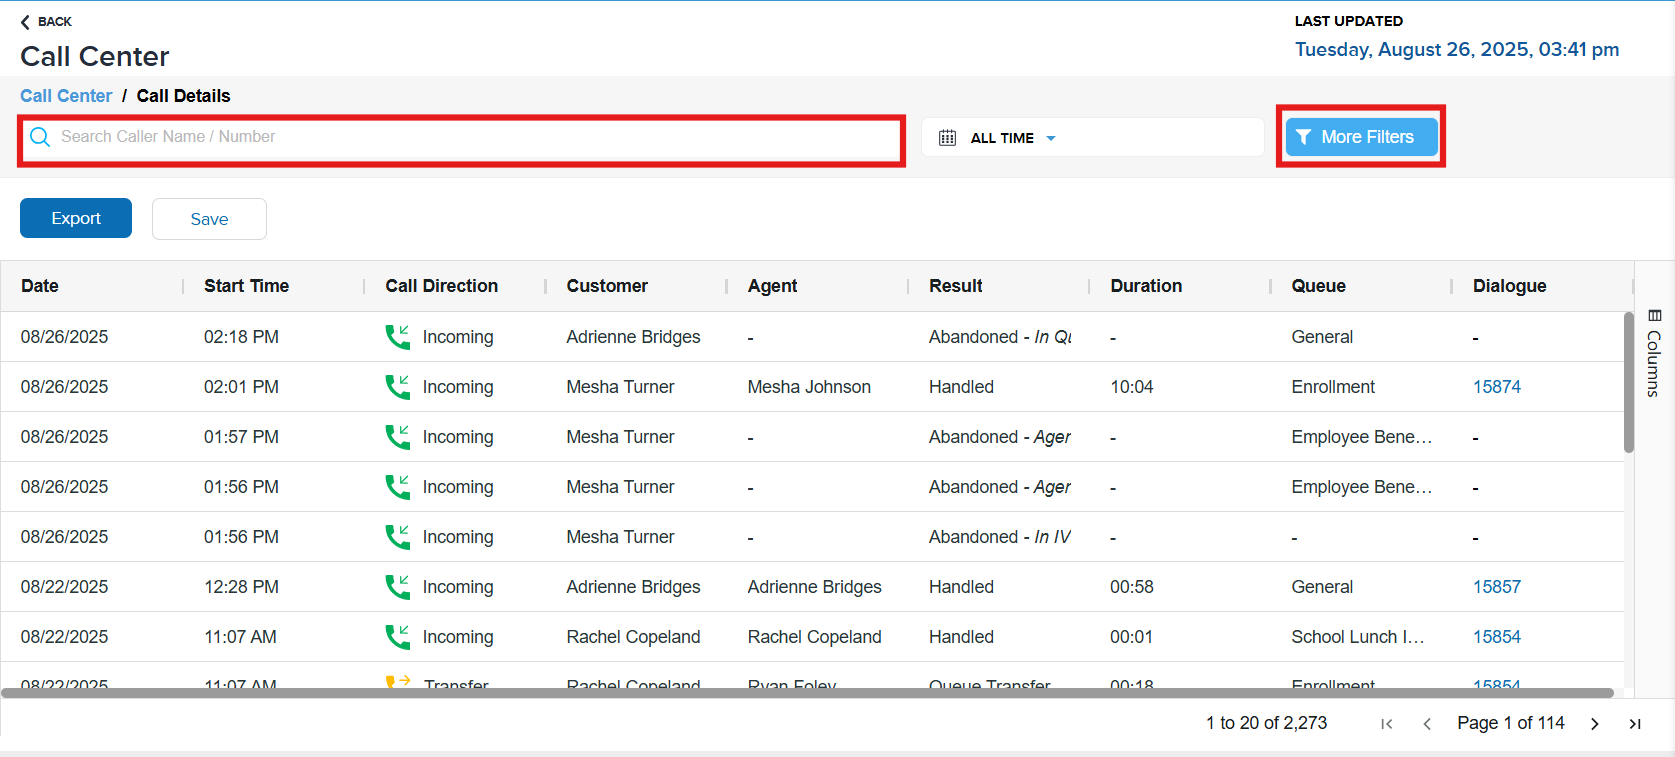
If you would like to Save or Export any saved searches you can do so by clicking the three vertical dots, then select either option.
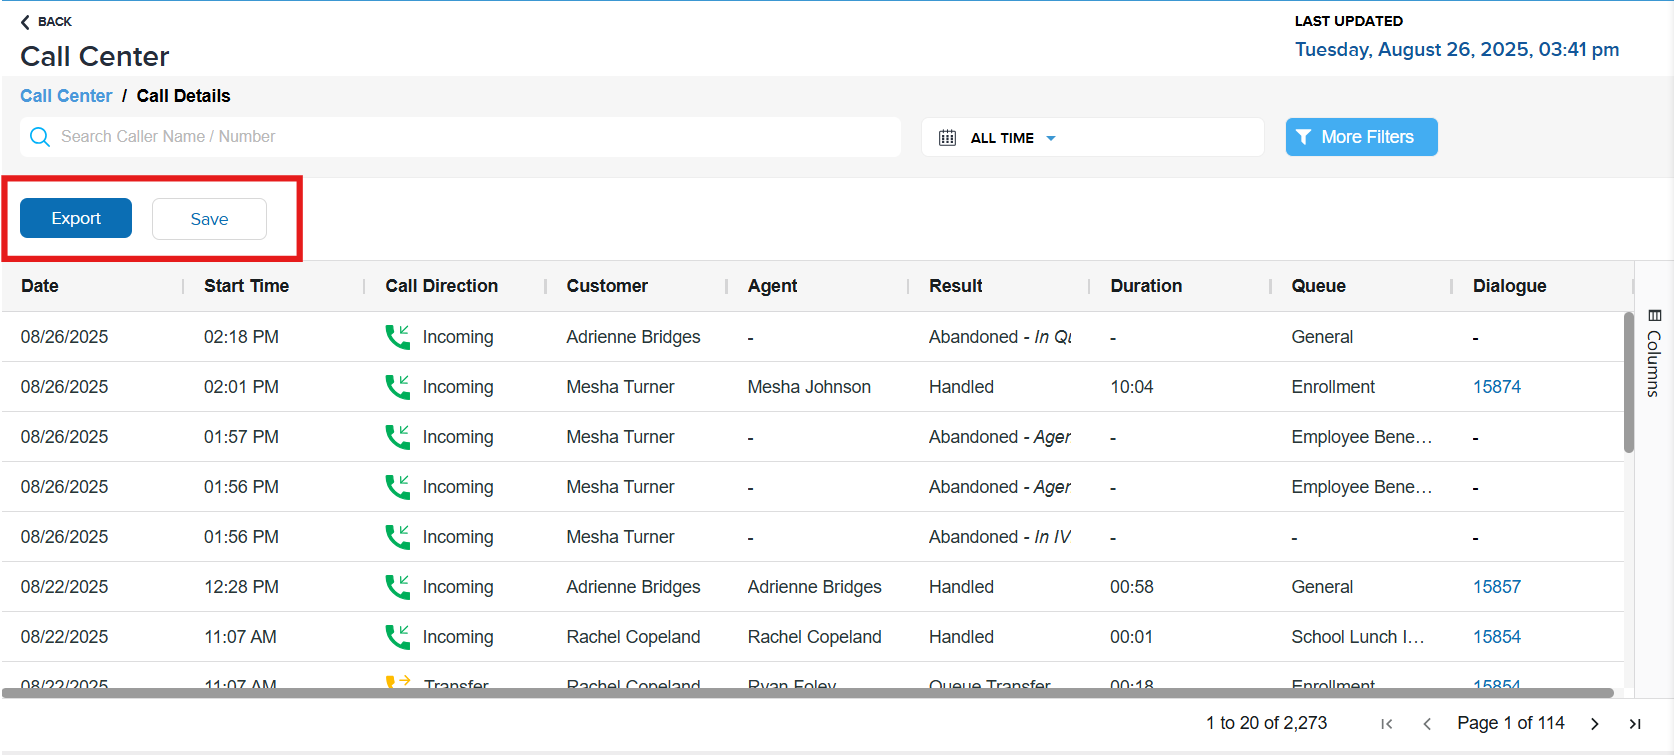
Saving the search will retain the results and be retained in the side panel for access. Exporting the report allow you to access the data by generating a .csv file for your records.
Live Data
Live data provides real-time insights into agent status and call queue activity. It tracks agent availability, showing whether agents are on a call or unavailable. Additionally, it displays the number of live calls in progress and calls waiting in the queue, allowing managers to monitor workload, adjust staffing, and ensure timely customer service. This data helps optimize operational efficiency and improve response times.
Agent Availability - Status and Status Change
Another useful feature of our dashboard is our Agent Status tile to identify patterns in agent call availability and status changes
Agent Status
When viewing the agent availability tile your agents can be in of the following statuses:
- Available - Agent is logged into Onflo ready; accepting Inbound call
- Unavailable - Agent is logged into Onflo; not accepting Inbound calls
- Engaged - Agent is on an active, Inbound call
- Offline - Agent is logged out of Onflo
Status Change
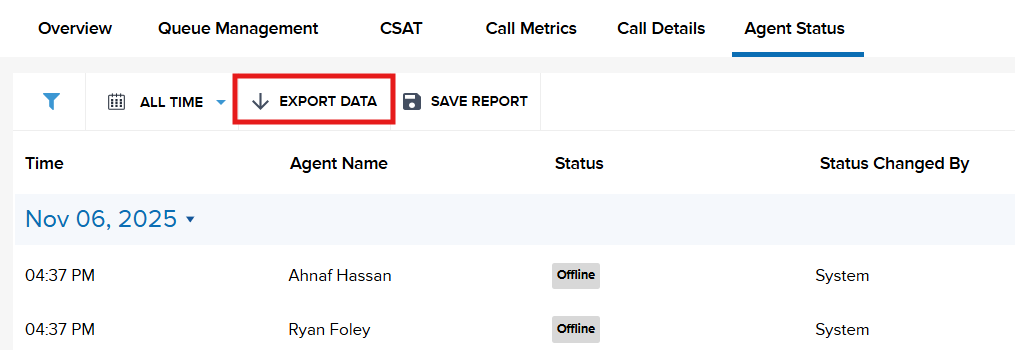
For a deeper dive into Agent Availability and when changes occur to an agent’s status click on dashboard icon. This view will allow you to see the following fields related to Status Change:
- Time
- Name of Agent
- Status
- Status Changed By
The Status Changed By field indicates that the status change was made in Onflo by one of the following categories:
- System - Onflo updates status based on call activity (ex.agent wrapping up a call)
- Agent - Agent switching status such as an agent logging into Onflo and switching from Unavailable to Available
- Administrator - System Administrator changes agent’s status
Queue Management
Our call center queue tracks live calls and calls waiting for assistance in real time. It provides visibility into the current volume of active calls and the number of customers waiting, helping managers monitor call flow and adjust staffing as needed.
For a deeper dive into Agent Availability and when changes occur to an agent’s status click on the icon. This view will allow you to see the following fields related to live call data.
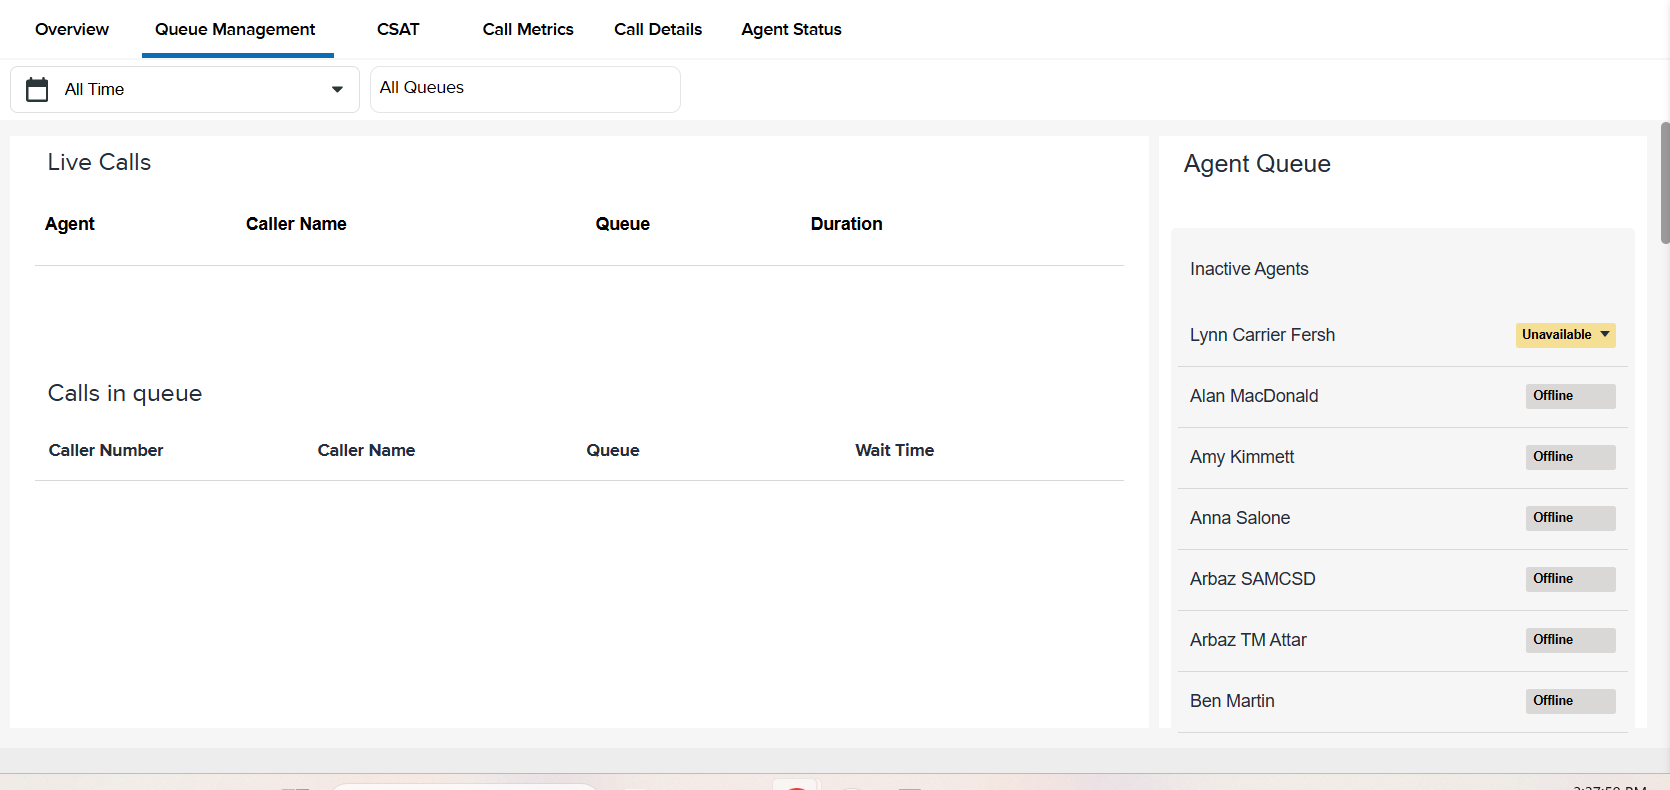
This information is divided into two categories:
Live Calls
- Agent
- Caller Name
- Topic
- Duration
Calls In Queue
- Caller Number
- Caller Name
- Topic
- Wait Time
Export Data - Agent Availability
System Administrators can export agent availability and status history for tracking and analysis. To export the data click the three vertical dots, then click Export. The data will export as a .csv file for ease of access.
