To help you understand the impact of your Chatbot - and to see trends that can help you improve your knowledge base - we have designed the Chatbot Report. (Access available for System Admins)
Access
To help you understand the impact of your Chatbot - and to see trends that can help you improve your knowledge base - we have designed the Chatbot Report.
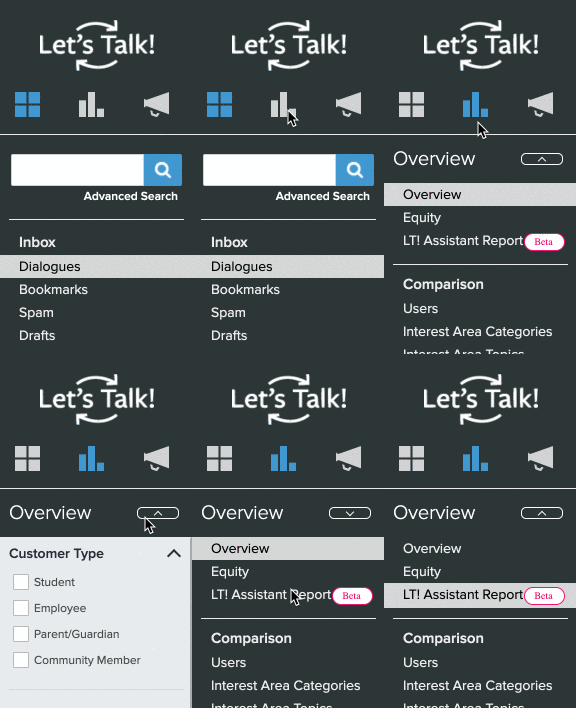
Overview
The first section of the report features the Overview section that contains metrics relevant to the chatbot interactions. The metrics below measure the following:
- Total Questions Asked: Total number of questions asked to the chatbot. This number measures each time the chatbot is engaged for the first time, as well as anytime a customer selects that they have another question they like to ask.
- Helpful: The number of times a customer selects that the answer provided by the chatbot is Helpful. This question comes after the chatbot sends over a response from the knowledge base.
- Unhelpful: The number of times a customer selects that the answer provided by the chatbot is Unhelpful. This question comes after the chatbot sends over a response from the knowledge base.
- Not Rated: The number of times a customer did not rate whether a response was helpful or not when prompted by the chatbot.
- No Answer: The number of questions the chatbot was exposed to that it was not able to provide a response for.
- Sessions Started: The number of times the chatbot has been engaged by a customer. This only measures the interaction, rather than the number of questions asked by a customer.
- Average Cx Score: The average Cx score recorded for chatbot interactions, only
- Note: customers are asked to rate their experience with the LT! Assistant on a five-star scale that is converted to a 10-point scale to align with other Onflo (formerly Let’s Talk) Cx metrics.
Tickets Submitted: The number of chatbot interactions that have resulted in a ticket submission in Onflo.
Engagement
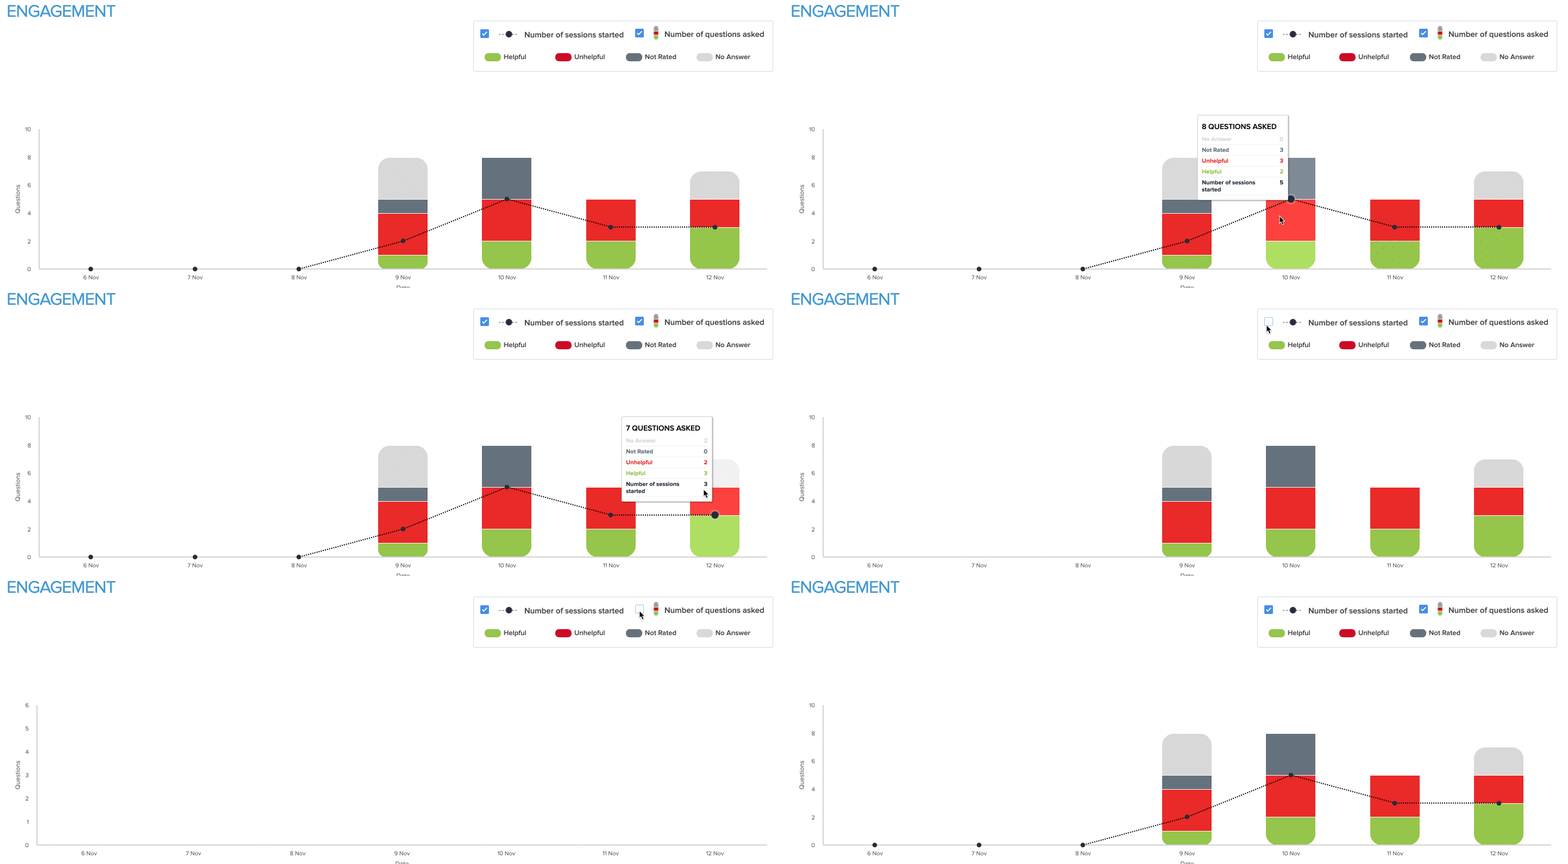
The Engagement section of the report is a graph that showcases the usage of the chatbot across time. The legend at the top right shows you the breakdown of the questions coming into chatbot for that period of time on the graph.
- Green indicates Helpful
- Red indicates Unhelpful
- Dark grey indicates Not Rated
- Light grey indicates No Answer
Interactive items:
- Hover over the bars to get a breakdown of how many questions asked fall into each category.
- Check or uncheck the Number of sessions started and Number of questions asked boxes in the legend to remove or enable it on the graph.
Tabs
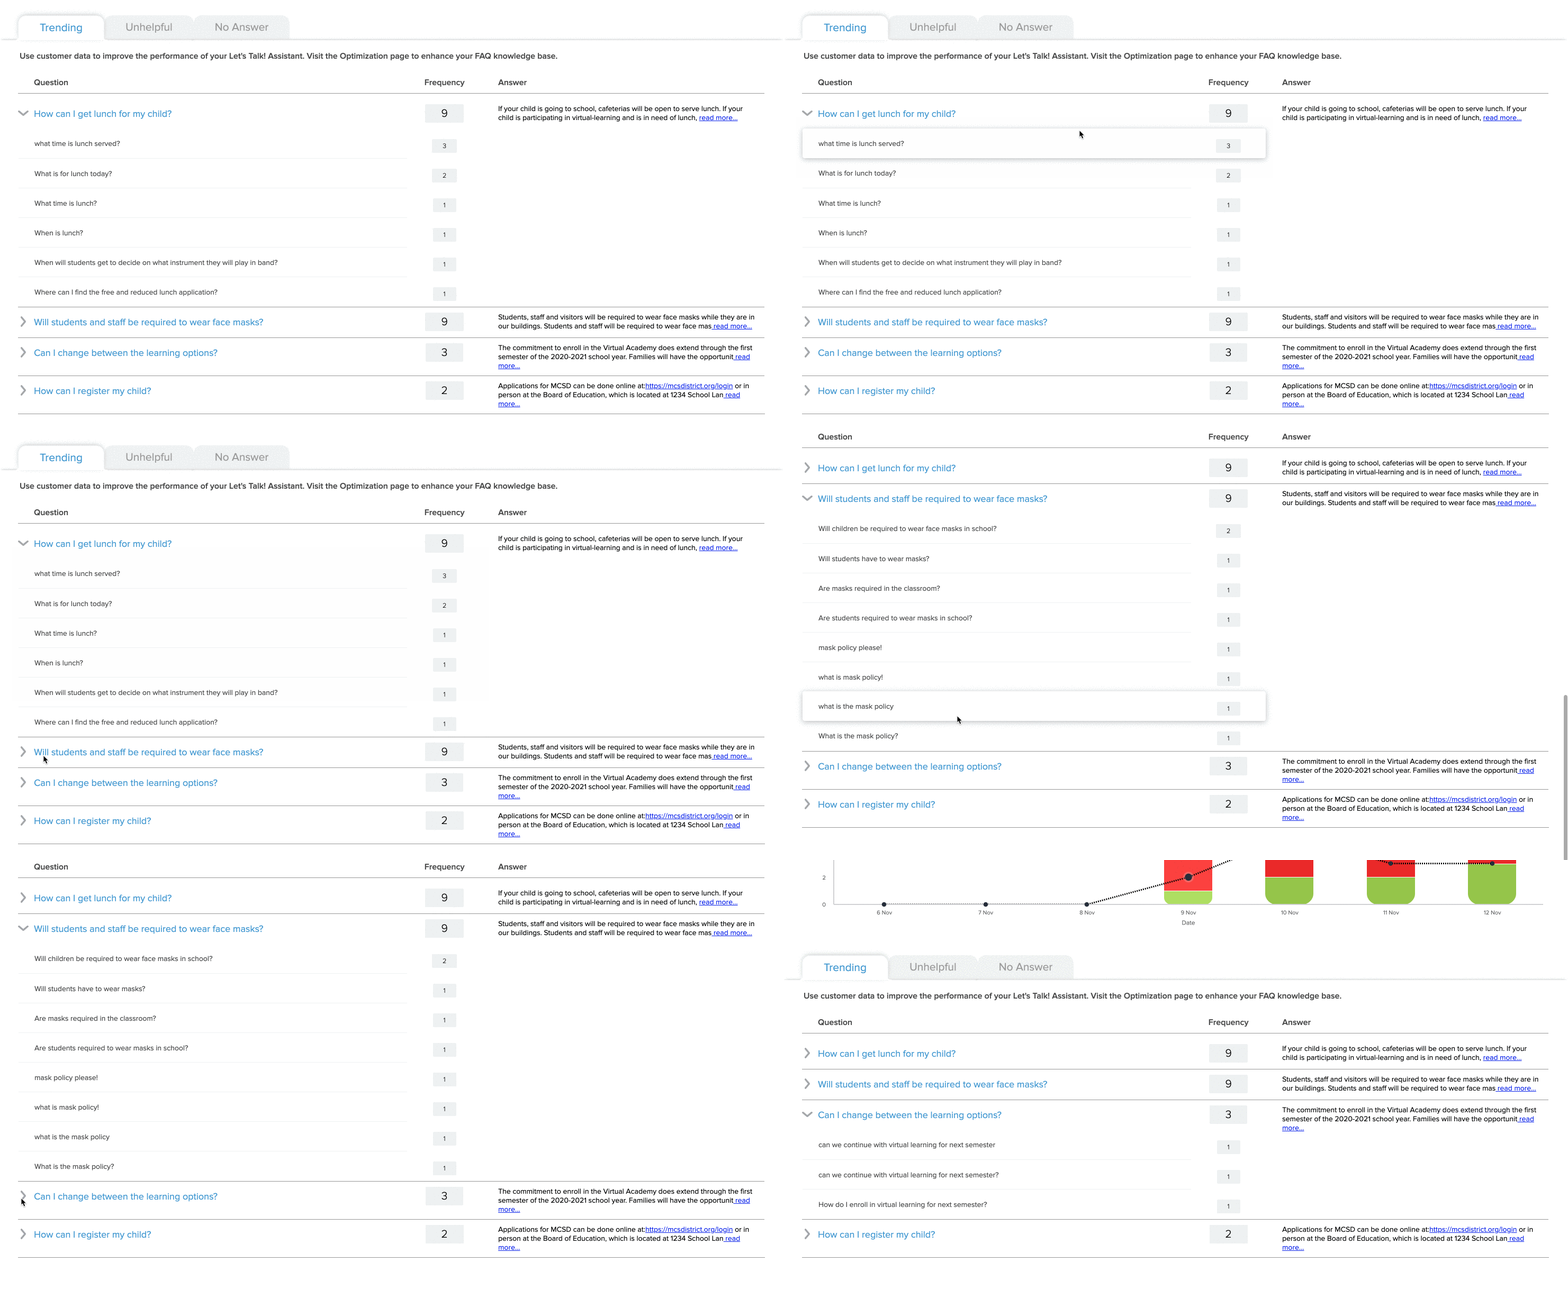
At the bottom of the report you will find three tabs that bucket questions into three groups: Trending, Unhelpful, and No Answer. Your district can leverage these tabs to enhance your knowledge base and outreach efforts by reviewing frequent inquiries, revising FAQs that are being misunderstood or not answering a question, and adding questions that have not been addressed within the FAQs at all.
Trending
Under the Trending tab, you can find the top five questions the chatbot has been asked by the community. The frequency number shows exactly how many times that question has been asked, and expand any question to see the exact wording the customers used to ask it. Click on the question itself to open up the specific interaction for a closer look.
Unhelpful
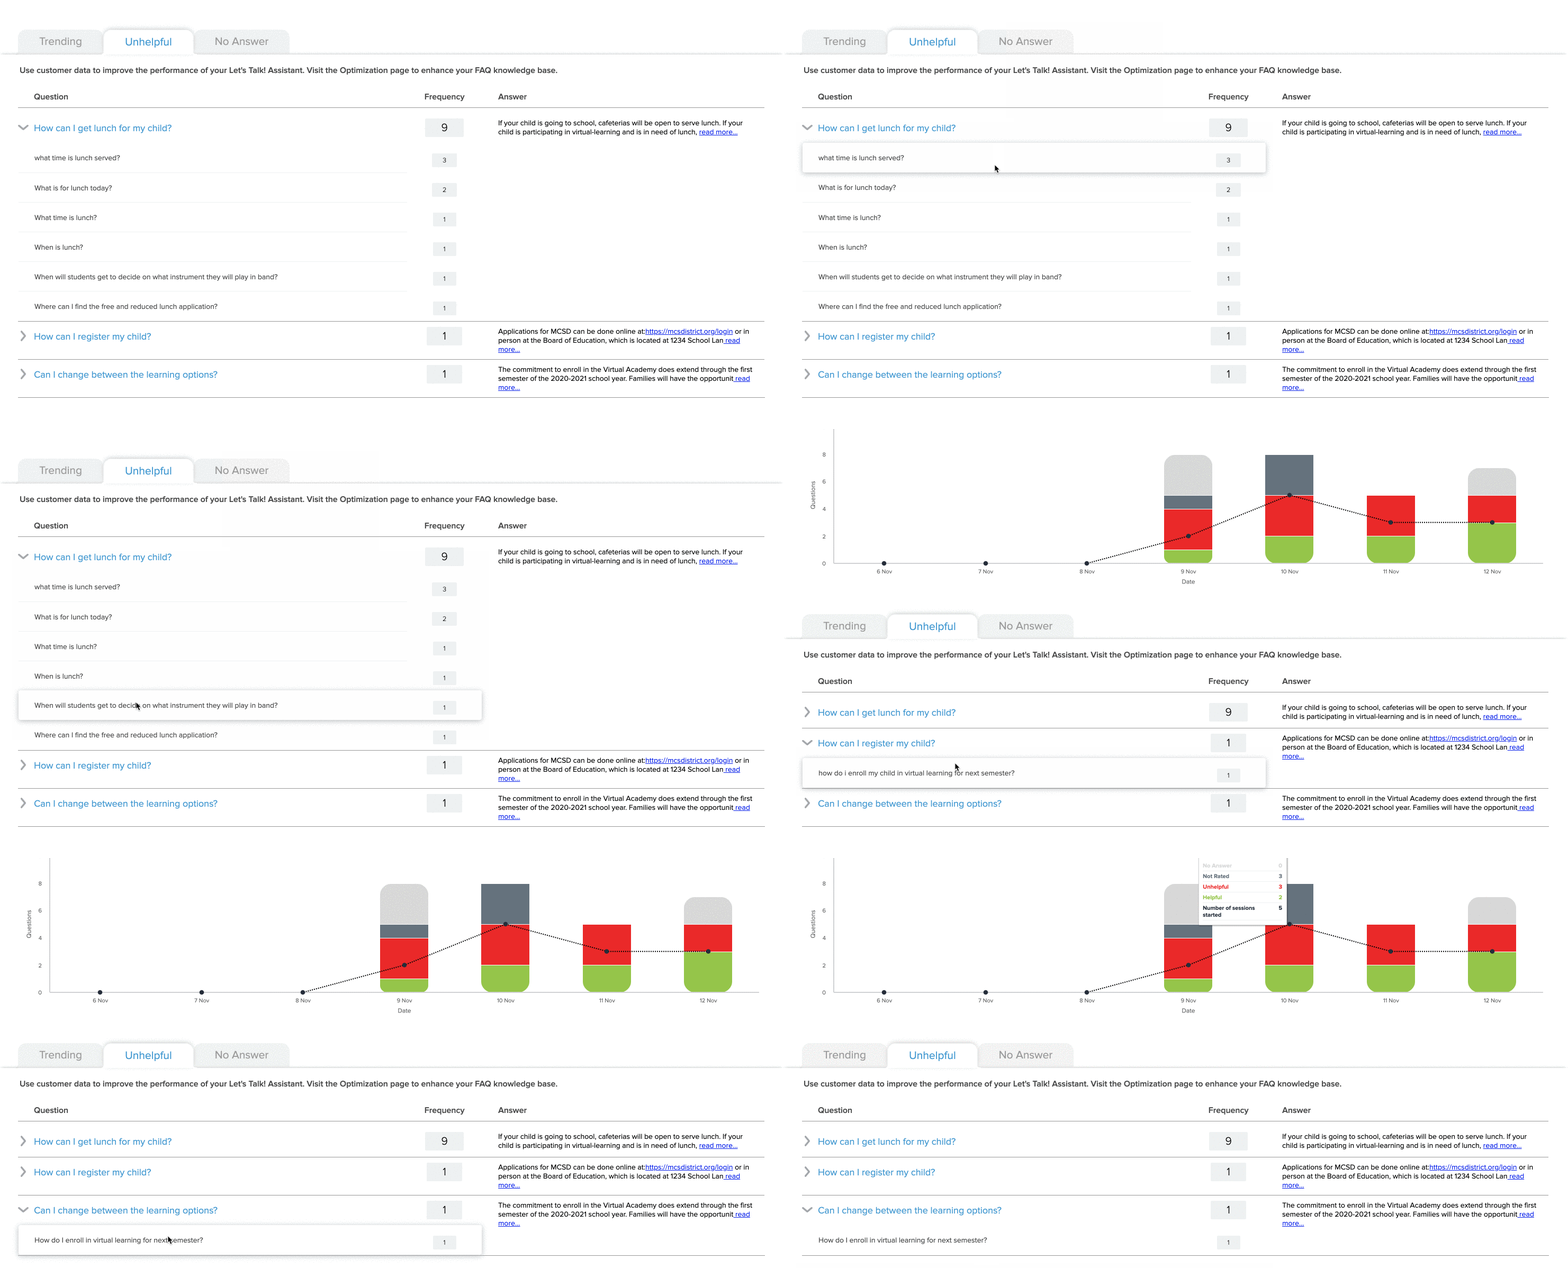
Under the Unhelpful tab, you can find any questions that customers have rated as unhelpful when prompted by the chatbot. The frequency number shows exactly how many times that question has been asked, and expand any question to see the exact wording the customers used to ask it. Click on the question itself to open up the specific interaction for a closer look.
No Answer
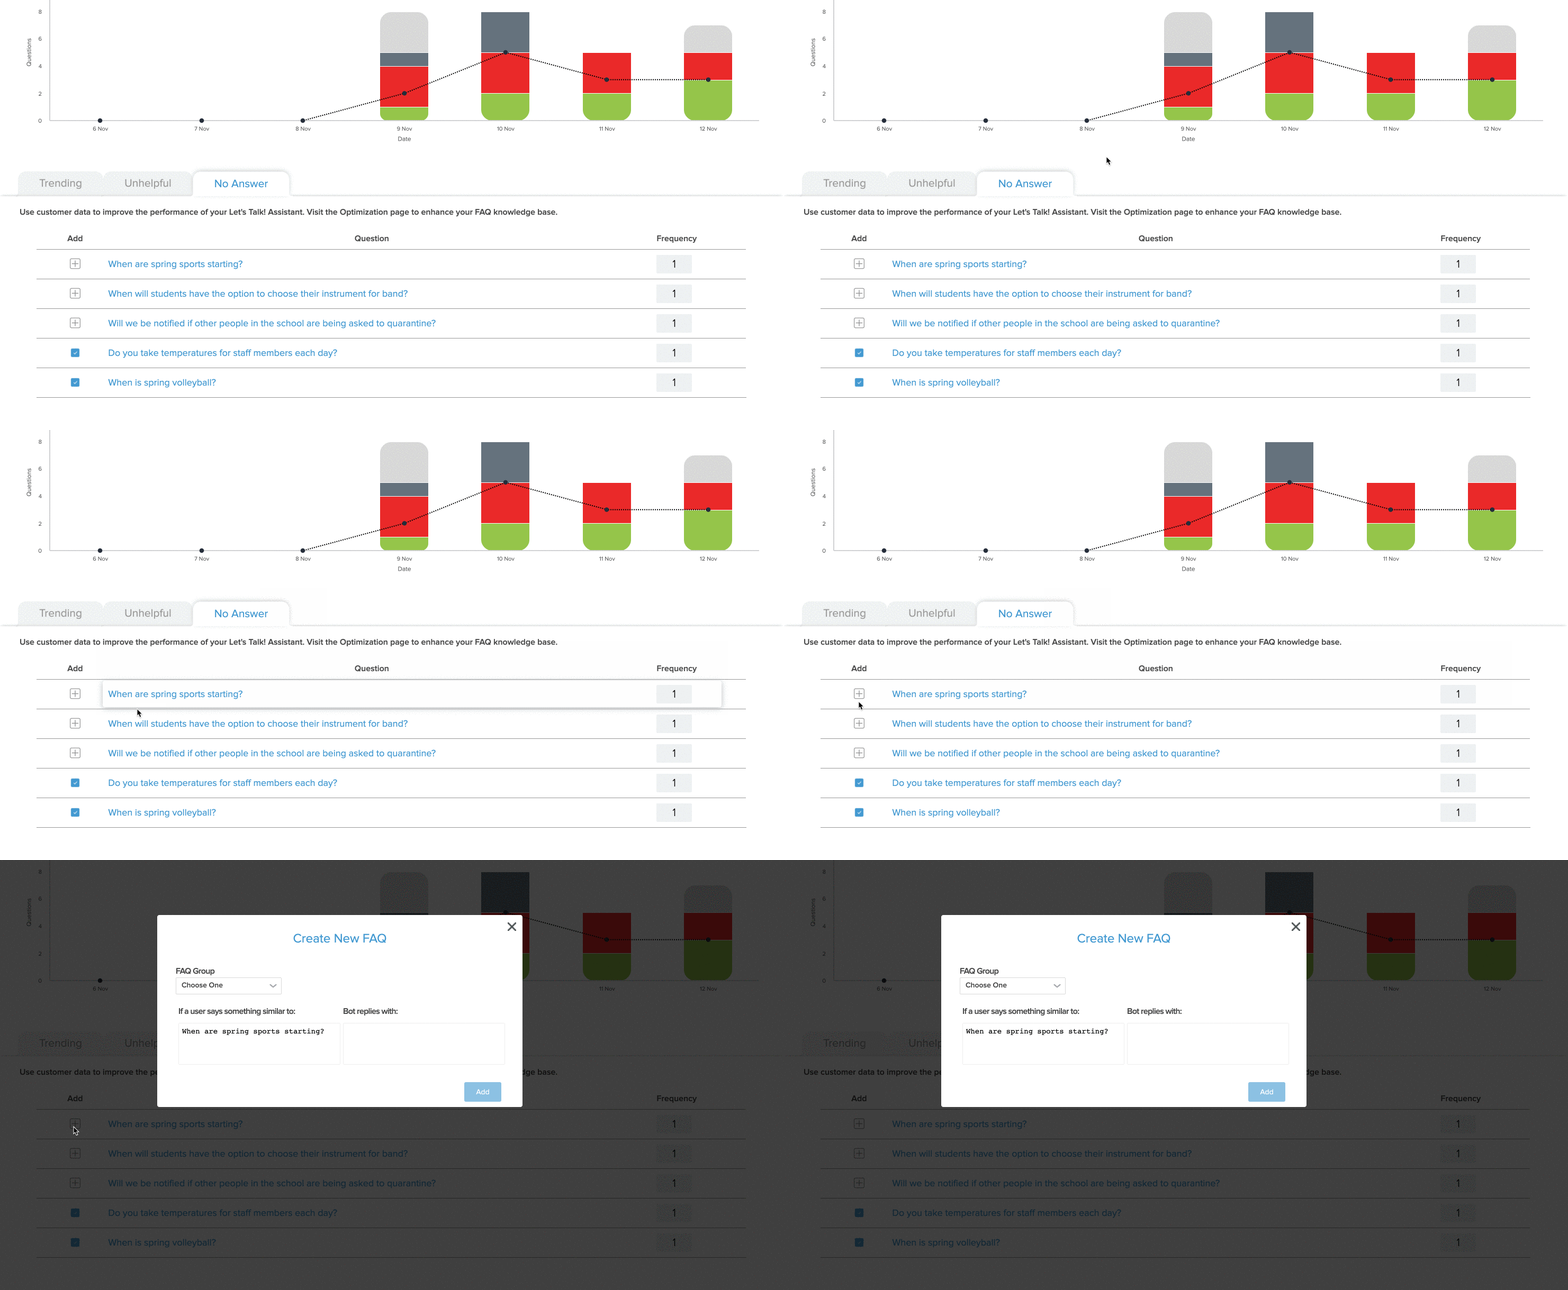
Under the No Answer tab, you can find all the questions that have been asked by the community that the chatbot did not have a predetermined FAQ response for. The frequency number shows exactly how many times that question has been asked. Take advantage of the plus icon by each question, which automatically starts the process of adding that question into your FAQ knowledge base.
When adding one of these questions, simply choose the group it falls under, edit the question phrasing, and include the answer to the question you wish to Add.
Filter
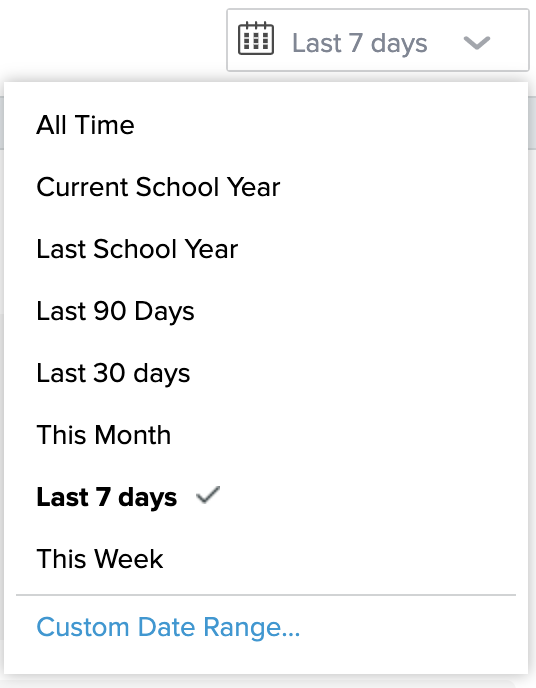
Like all other dashboards in Onflo, at the top right-hand corner of the report, you can find the date filter. This filter will change your data to only reflect the time period you select. Choose from any of the preset date ranges or click on Custom Date Range to create your own.
